MDT Monitoring – Deep Dive II – Consuming the data yourself
As mentioned in my last post, MDT 2012 comes with an interesting monitoring option. It installs a web service, where events are being posted to and which the workbench queries to get the current status of all running and recently finished deployments.
But as we also got aware, it’s posting a lot more information as visible in the workbench. So if you would like to see all the stuff that’s going on there and would like to do some more advanced processing/reporting on this stuff, you are reading the correct blog post ![]()
How does MDT post the events to the web service?
First we need to know exactly, what MDT does, when it’s posting the events, so that we are able to consume and process them properly. To get this information, we open the ZTIUtility.vbs (the MDT core library) and search for a function called “CreateEvent”
The first half of this function contains the logic that implements the EventShare property. Let’s skip this for now.
The second half is the more interesting part. It creates a web service object, builds a list of parameters to supply, calls the web service and stores the unique ID for further usage during this deployment. Let’s have a look on the latter three.
Building the parameters (originally only three lines of code, just made it a bit more readable):
|
1 2 3 4 5 6 7 8 9 10 11 12 13 14 15 16 |
sID = oEnvironment.Item("UUID") & "," & Join(oEnvironment.ListItem("MacAddress").Keys, ",") sLine = "uniqueID=" & oEnvironment.Item("LTIGUID") sLine = sLine & "&computerName=" & oUtility.ComputerName sLine = sLine & "&messageID=" & CStr(iEventID) sLine = sLine & "&severity=" & CStr(iType) sLine = sLine & "&stepName=" & oEnvironment.Item("_SMSTSCurrentActionName") sLine = sLine & "¤tStep=" & sCurrentStep sLine = sLine & "&totalSteps=" & sTotalSteps sLine = sLine & "&id=" & sID sLine = sLine & "&message=" & sMessage sLine = sLine & "&dartIP=" & oEnvironment.Item("DartIP001") sLine = sLine & "&dartPort=" & oEnvironment.Item("DartPort001") sLine = sLine & "&dartTicket=" & oEnvironment.Item("DartTicket") sLine = sLine & "&vmHost=" & oEnvironment.Item("VMHost") sLine = sLine & "&vmName=" & oEnvironment.Item("VMName") |
Which gives us a list of all the values that are being posted.
Now it calls the web service and stores the result
|
1 2 3 4 5 6 |
' Call the web service oService.WebService = oEnvironment.Item("EventService") & "/MDTMonitorEvent/PostEvent?" & sLine oService.Method = "GET" oService.Quiet = true Set oResult = oService.Query |
This tells us, that it adds “MDTMonitorEvent” to the path of our EventService property and that it assumes a function called PostEvent. It’s using the HTTP Get method. And executes this web service quietly. As this is hard-coded and we don’t want to implement any changes in the MDT scripts, we should remember this when create out own web service.
Finally, it takes the GUID, contained in the result and stores it in the property LTIGUID, which will then be used in any future web service call for this deployment.
|
1 2 3 4 5 |
' Remember the returned GUID value If oEnvironment.Item("LTIGUID") <> oResult.DocumentElement.Text then oEnvironment.Item("LTIGUID") = oResult.DocumentElement.Text End if |
Nothing fancy so far. So let’s create our own web service.
Create a web service
I’ve published already a couple samples on how to create a custom web service. E.g. in “Easily access information from any database and publish it via a web service – Part 2 – The Web Service”.
Using Visual Studio 2010 (Express edition should also work), we create a new, empty ASP.Net MVC 3 project. For web services I typically prefer the “old-style” asmx based web services, but as the web service call is hardcoded in MDT, pointing to a fixed URL, it would become a bit more complicated with re-routing etc. so I use something, that supports this out of the box. We could also use plain ASP.Net or WCF projects, or whatever you prefer. I chose MVC 3 as it’s pretty easy to implement and we can also use it easily to add some reporting to it.
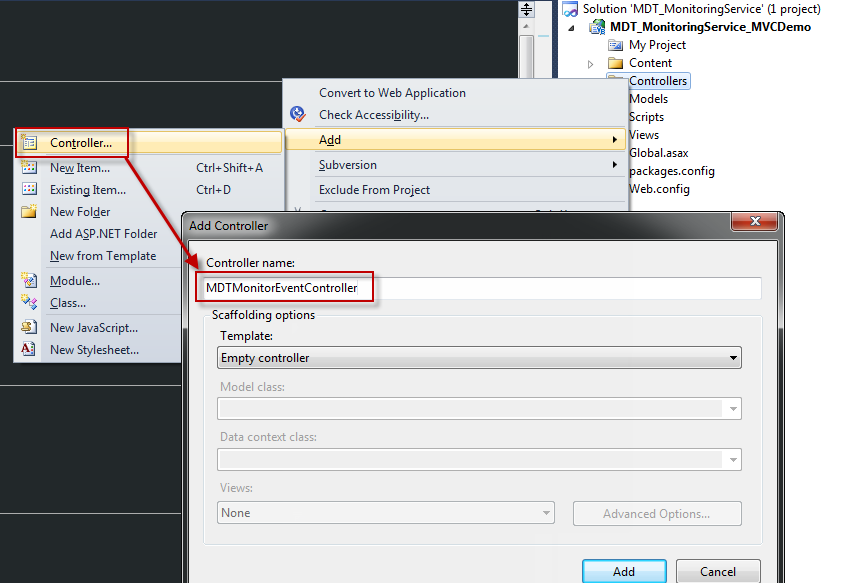
Now, as MDT uses MDTMonitorEvent in the URL, we keep it simple and use the same. So let’s add a new Controller to our MVC 3 project, called “MDTMonitorEventController” (be sure to have the “Controller” at the end of the name as MVC is driven by certain conventions).
The function MDT is using is called “PostEvent”. So we add a new function to our controller and call it “PostEvent” as well. And also add all the parameters, that we have seen above while evaluating the ZTIUtility.vbs. This way, we can make use of the default routing in MVC, so “/MDTMonitorEvent/PostEvent” will point to the controller and our action we have just created and consume all the information MDT is sending to us.
|
1 2 3 4 5 6 7 8 9 10 11 12 13 14 15 16 17 18 19 20 21 22 23 |
Function PostEvent(uniqueID As String, computerName As String, messageId As String, severity As String, stepName As String, currentStep As Short?, totalSteps As Short?, id As String, message As String, dartIP As String, dartPort As String, dartTicket As String, vmHost As String, vmName As String) As ActionResult ' Make sure we have a unique ID for this deployment If String.IsNullOrEmpty(uniqueID) Then uniqueID = Guid.NewGuid.ToString End If Return New XmlResult(uniqueID) End Function |
So far, it’s not really doing much. It’s just creating a new GUID if there isn’t a uniqueID supplied and then returning this uniqueID wrapped in XML, as MDT expects it this way. In case you’ve used MVC 3 before and wonder about this ActionResult, the XMLResult has been taken from the MVCContrib project. It just converts a given object into XML and returns it. I’ll supply the whole project for download on CodePlex at the end of this post. So no need to worry.
That’s actually already enough to run the project in Visual Studio (or deploy it to a test directory in IIS) and open the path to our MDTMonitorEvent/PostEvent function. If we do this, we should see, that it returns a GUID (remember, we create a new one, if we don’t supply one?)
Now every time we refresh the page, we get a new GUID. For verification, we supply a GUID as parameter “uniqueID” and should see, that the function returns the same GUID:
Get the MDT Workbench monitoring part working again
We are now ready to get the information from MDT. And are able to do whatever we want with it. Store it in a database, write it to a log file, do some evaluation, etc. But if our deployments post to this function instead of the MDT built-in one, the workbench won’t show anything. Which is ok, if we have our own monitoring solution. But it would also be nice, if we just seamlessly integrate our solution and everything else still works as before.
There are a couple options to achieve this.
We could write a second web service, that returns the data to the workbench. But that means, we would need to re-invent something, that is already being done by the MDT web service. And it’s actually pretty tough to tell the workbench to get the information from a different place or in a slightly different way as a lot of it is hardcoded.
So how about just passing this information back to the original MDT web service?
This way we can consume the data we want, while not really touching anything that comes out of the box and the monitoring tab in the Workbench will still work.
As this is just a Proof-Of-Concept, it’s not pretty and more like a hack, but it’s working. So we just add the following lines to our “PostEvent” function that will just prepare all the information we received, and forward it to the MDT Web service:
|
1 2 3 4 5 6 7 8 9 10 11 12 13 14 15 16 17 18 19 20 21 22 23 24 25 26 27 28 29 30 31 32 33 34 35 36 37 38 39 40 41 42 43 |
' Forward information to original MDT service Try Dim param As String ' Prepare parameters param = "uniqueID=" & HttpUtility.UrlEncode(uniqueID) param &= "&computerName=" & HttpUtility.UrlEncode(computerName) param &= "&messageID=" & HttpUtility.UrlEncode(messageId) param &= "&severity=" & HttpUtility.UrlEncode(severity) param &= "&stepName=" & HttpUtility.UrlEncode(stepName) param &= "¤tStep=" & HttpUtility.UrlEncode(currentStep) param &= "&totalSteps=" & HttpUtility.UrlEncode(totalSteps) param &= "&id=" & HttpUtility.UrlEncode(id) param &= "&message=" & HttpUtility.UrlEncode(message) param &= "&dartIP=" & HttpUtility.UrlEncode(dartIP) param &= "&dartPort=" & HttpUtility.UrlEncode(dartPort) param &= "&dartTicket=" & HttpUtility.UrlEncode(dartTicket) param &= "&vmHost=" & HttpUtility.UrlEncode(vmHost) param &= "&vmName=" & HttpUtility.UrlEncode(vmName) ' Create URL Dim BaseURL As String = WebConfigurationManager.AppSettings("MDTMonitoringURL") & "/MDTMonitorEvent/PostEvent?" Dim URL As New Uri(BaseURL & param) ' Send data Dim client As WebClient = New WebClient() Dim data As Stream = client.OpenRead(URL) ' Read uniqueID from MDT Dim reader As StreamReader = New StreamReader(data) Dim MDTXMLResult As XmlDocument = New XmlDocument Dim xmlString As String = reader.ReadToEnd reader.Close() MDTXMLResult.LoadXml(xmlString) If MDTXMLResult.ChildNodes.Count > 0 Then uniqueID = MDTXMLResult.ChildNodes(0).InnerText End If Catch exc As Exception Trace.WriteLine("Exception: " & exc.Message) End Try |
To keep it a little bit easier to configure, we store the information about the original MDT Monitoring web service in the web.config in an application setting (MDTURL).
|
1 2 3 |
<appSettings> <add key="MDTURL" value="http://localhost:9800"/> </appSettings> |
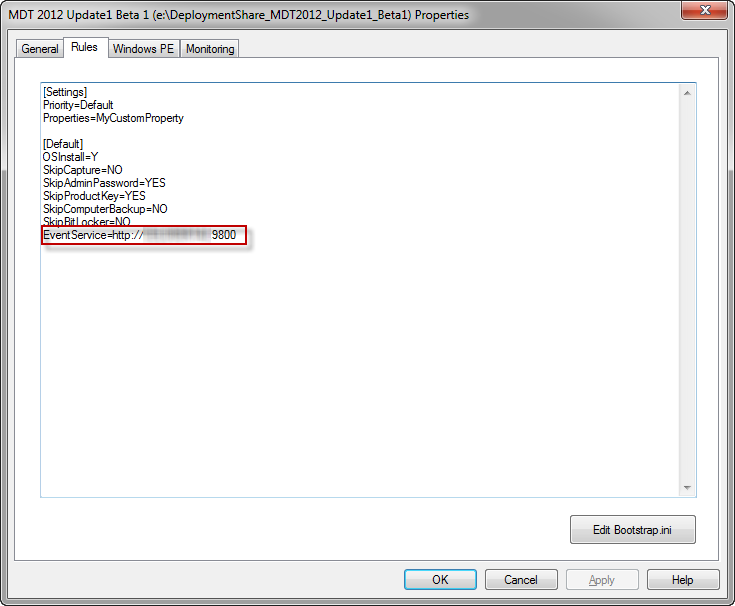
Just use the same URL, that MDT is using in the EventService property (stored in your customsettings.ini):
In this sample, it’s installed on the same computer, so I can use “Localhost” instead.
Now if we run our project again and open the URL as shown before and supply a couple more parameters, it should pass this information to our workbench. And Voila!
Process the information
OK, so far, we don’t do anything with the information we now can get from MDT beside forwarding it to MDT again. This is, ehm, well, not optimal. It works for a demonstration, but let’s at least save this information to a file, so we can see what event are being sent during a deployment. Then we can extend our solution later.
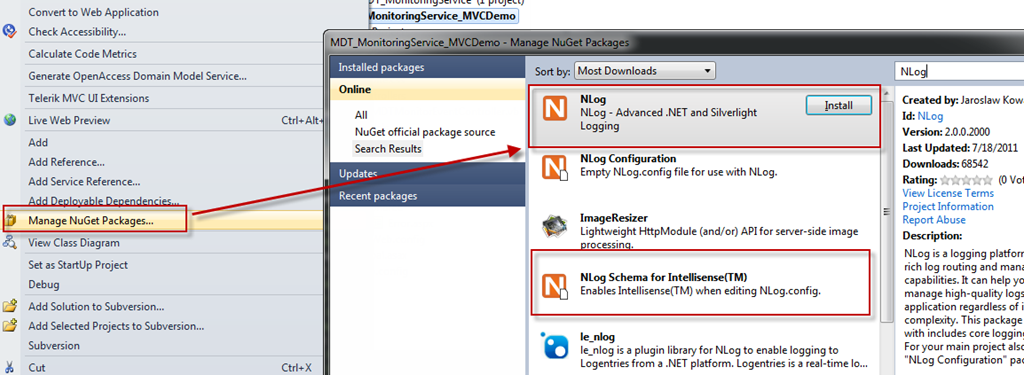
To keep this easy, I use my preferred logging solution NLog, that I posted already about in “Add logging to your applications. NLog for beginners.”. Adding this to the project is now easier than ever before, as it is available via Nuget and so can be added to your project from within Visual Studio. Just install Nuget if you haven’t already. Then right click in your project and choose “Manage NuGet Packages …” and search for NLog. I recommend installing NLog and also the NLog Schema for IntelliSense. This will make it easier to create the NLog config file.
After the installation has been finished, you will see a new “NLog.config” file in your project root. Open it and define a new File target and a new rule to write all Info messages to this file. E.G. similar to this:
|
1 2 3 4 5 6 7 8 9 10 11 12 13 14 15 16 17 |
<?xml version="1.0" encoding="utf-8" ?> <nlog xmlns="http://www.nlog-project.org/schemas/NLog.xsd" xmlns:xsi="http://www.w3.org/2001/XMLSchema-instance"> <!-- See http://nlog-project.org/wiki/Configuration_file for information on customizing logging rules and outputs. --> <targets> <target xsi:type="File" name="Info" fileName="${basedir}/logs/Info_${shortdate}.log" layout="${longdate}: ${message}"/> </targets> <rules> <logger name="*" level="Info" writeTo="Info" /> </rules> </nlog> |
The installation of NLog also adds a snippet to Visual Studio that eases the creation of log entries. So if we now open our MDTMonitorEventController class and type “nlogger” followed by a double tab, it will be expanded to the following line
|
1 |
Private logger As NLog.Logger = NLog.LogManager.GetCurrentClassLogger() |
And now you can use this object to write log entries. As mentioned, we just want to log some information about each event. So we simply add the following lines to the end of our “PostEvent” function, that will log some information like computername or the current step. Again, this is a Demo, so please be kind with me ![]()
|
1 2 |
' Log the information for demonstration purposes logger.Info("{0} - {1} ({2}/{3}) - {4} ({5}) - {6}", computerName, stepName, currentStep, totalSteps, message, messageId, uniqueID) |
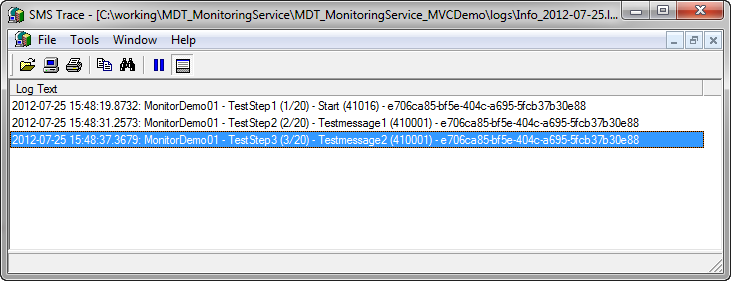
If we test this again as described before, we should now see those entries in the files created in the logs folder.
and also the latest entry in the workbench
Configure MDT to use a different web service
Now as we can theoretically (and hopefully practically) consume the data that comes from MDT, we need to know, how we can configure MDT to talk to our own web service. Which is actually pretty easy.
First, we need to deploy our web project to IIS or you download the sample project from CodePlex and add it as a new application to IIS (only tested on Server 2008 R2).
Above you have seen the “EventService” property in the customsettings.ini. All we need to do is changing this to the path to our own web service like “http://YourWebServer/YourWebDirectory”.
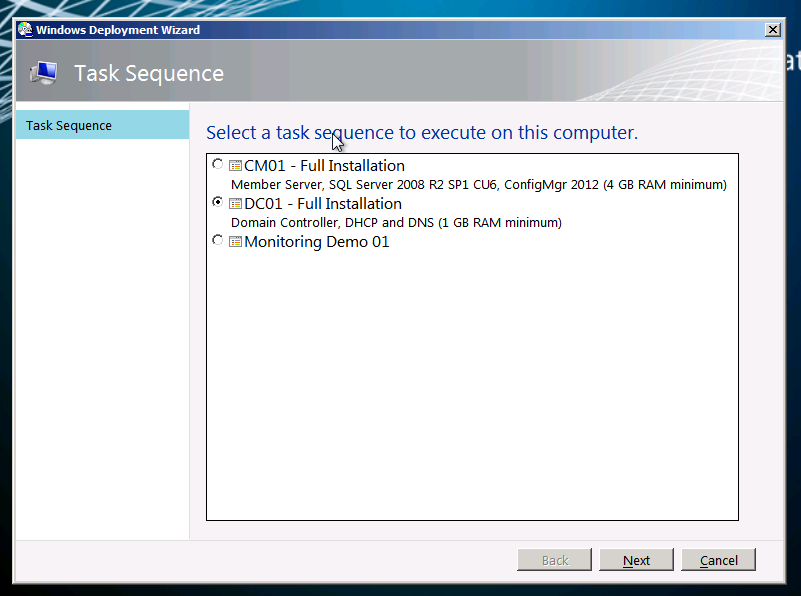
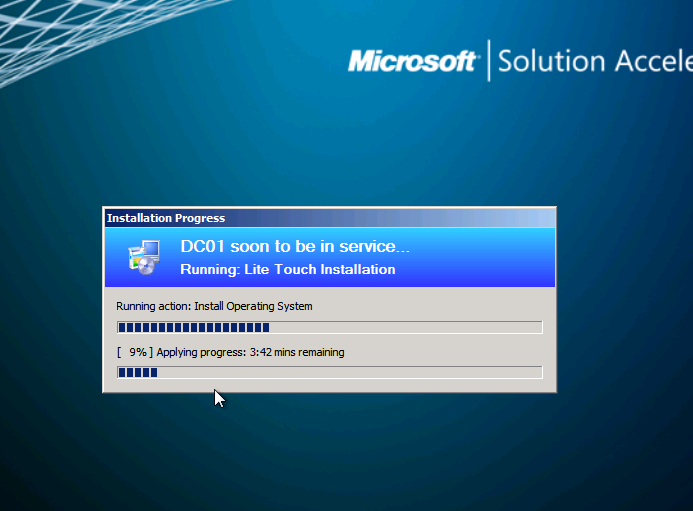
Now when you start a new deployment, you should see it in the workbench as before and also should be able to see each individual event in the log file. In the screenshots below, I was running a Deployment of a Domain Controller based on Johan Arwidmarks Hydration Kit for ConfigMgr 2012.
From the workbench before the Task Sequence starts
Choosing a Task Sequence
And then some time into the process
The workbench just shows the current status
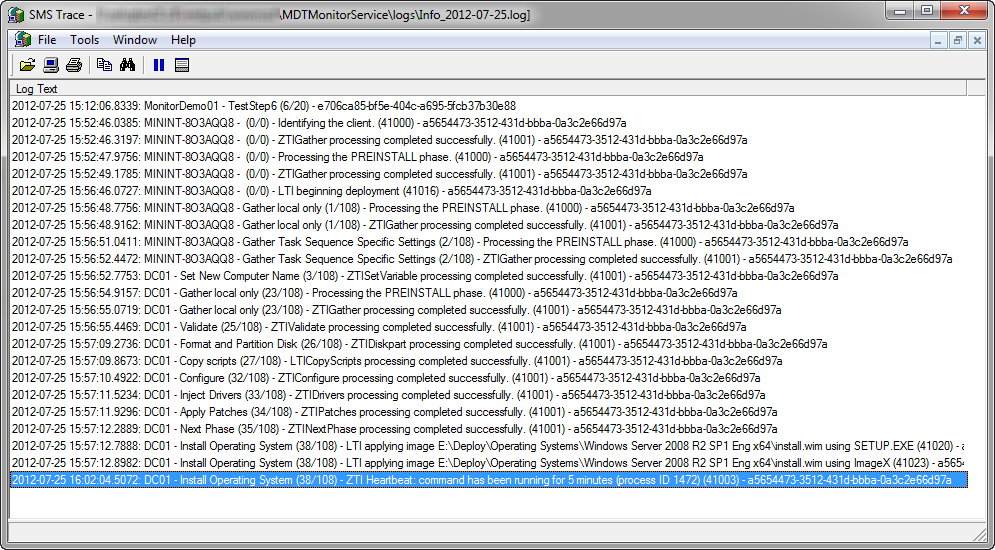
But as you can see in the log, a lot more has happened already
After the deployment has finished, we have something like 70 entries in the log file, so enough information to work with.
I’ve published the compiled files to CodePlex (download here) again, and in one of the next posts, we are going to extend this solution, so we actually do more with it then just logging each step. I will also publish the source code soon. As always, this solution is provided AS IS. As it’s currently just a demonstration project, it’s only meant for testing. Please get back to me if you have any questions or feedback.






Recent Comments