MDT Monitoring – Deep Dive I
The new monitoring feature is probably one of the most interesting and underestimated features of MDT 2012. In this version, its just some “initial” implementation, but it has great potential and in contrast to other custom extensions that have been available before, it’s tightly integrated and working out-of-the-box with support from Microsoft.
What I won’t cover in this post is how to set it up and troubleshoot. As there has been some great posts already that cover all this in every detail. Please check
Introduction into MDT 2012 Monitoring
and
Troubleshooting MDT 2012 Monitoring
from the Mr. MDT Michael Niehaus himself.
Reasons to monitor your deployments
Automating deployments, doing this as zero-touch as possible has some huge advantages. But with this automation arise some requirements. One of the main reasons to automate such processes is to get rid of manual work. But this also means, that there isn’t necessarily someone in front of the computer, being able to react on problems or errors. Also, even if MDT is pretty easy to set up and use, the whole solution can be pretty complex at certain areas. And if something happens it can require some advanced skills to get a problem fixed. This means, it becomes a requirement, to keep track on deployments. Track problems and errors during deployments, to be able to fix them either immediately so this computer can be deployed as requested. But also get aware on smaller issues or problems, that might become a problem in future or in large scale deployments. We might want to know common problems, to have solutions available for the tech support. We might want track how long it takes on different machines, maybe even track the time of individual time consuming steps, to improve the overall time it takes but also to get aware, if the time on the whole deployment or individual steps increases over time, which might indicate a problem. Maybe to many updates, that should be integrated in the Reference image now. Better to get aware of this, before we reach the expected SLAs.
So lets have a deeper look on what MDT Monitoring does in the current version, where it supports us and where it still lacks some capabilities.
Monitoring options
First, there has always (well, not always, but since quite some time) been some kind of “central” logging/monitoring options within MDT.
We have the possibility to have the logs copied to a central share at the end of the deployment, using the MDT SLShare property. Or we can use the SLShareDynamicLogging, which writes all the logs at runtime to this share. Having the logs available is great, but also requires you to parse those logs for errors, warning, problems, etc. and if used in larger deployments, its becoming even more difficult to keep track.
There is also the “EventShare” property available. Its basically the predecessor of the current MDT Monitoring. We can specify a central network share and certain events are written to this share, where they can be picked up by a central monitoring solution. This could be a solution like SCOM, but Daniel Oxley, one of the Deployment Guys, wrote a small hta, that can monitor this share and give us some information. Please see Simple deployment monitoring for more information.
MDT 2012 Monitoring
With MDT 2012, there is now another option we can use, which is built into the Deployment Workbench (Please see links at the beginning on how to install and configure it). The MDT team actually extended their already existing function, that writes events to the EventShare, to write the same events also to a web service (There was someone before, that said web services are cool ![]() ), that comes with the workbench. This web service gets a lot more information then we had available before using the EventShare. On every event, it sends the following information to the web service
), that comes with the workbench. This web service gets a lot more information then we had available before using the EventShare. On every event, it sends the following information to the web service
- ID(s) of the computer – a comma separated list of the UUID and all Mac Addresses
- A unique ID, that identifies each individual deployment
- The current computer name
- The Message ID, severity and the message text
- The current Task Sequence step Nr, step name and the total amount of steps
- DaRT information (IP Address, Port and Ticket)
- Virtual Machine information (Host name and VM name)
The web service, installed by the Workbench consumes this information, does some processing like calculating the current progress, the processing time, etc. and makes this information available in the Workbench. On certain events, it will also log this information into the event log of the computer running the monitoring web service, which we could use to bind some tasks to those events.
In the workbench, we can now see the progress of each running or recently finished/failed deployment. Additionally it will also allow us to connect to the remote computer, using Remote Desktop, VM Connection or DaRT Remote Control, depending on the supplied information and current phase. Very helpful if you experience any issues, that require you to get a hand on the remote computer.
Event logging
As mentioned, the web service will write certain events to the event log. Those events are:
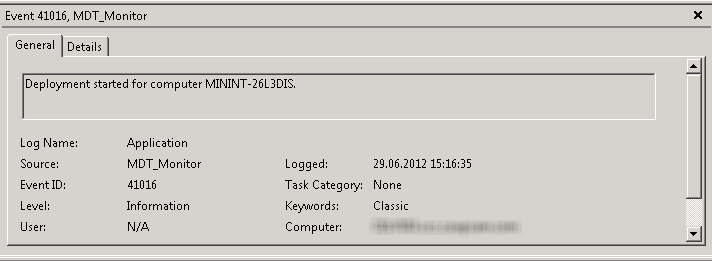
- a Deployment has started (EventID 41016)
- a Deployment completed successfully (EventID 41015)
- a Deployment failed (EventID 41014)
- an error occurred (EventID 3)
- a warning occurred (EventID 2)
So we could create tasks that run on those events, coming from “MDT_Monitor”, e.g. send an email, if a deployment completed.
More events
But those are just a few of the events, that are being posted the web service. On any step that has been processed, an event will be posted. On long running steps, also the heartbeat (typically 5 min), so one can see if it’s still running. Now one would think, that those events would be ideal for e.g. the time monitoring. But this information isn’t available out of the box. The web service stores only the very last event as the workbench is mainly used to show the current status. It’s not meant for any advanced reporting, so there is also no need to store any historical information. But we will get to the additional events in a later post.
Get the current Monitoring information
Now let’s have a look on the information that is available. The easiest way is using the MDT Workbench in the “Monitoring” node and as shown by Michael Niehaus in the posts I’ve linked at the beginning.
However, there are two additional ways to read this information.
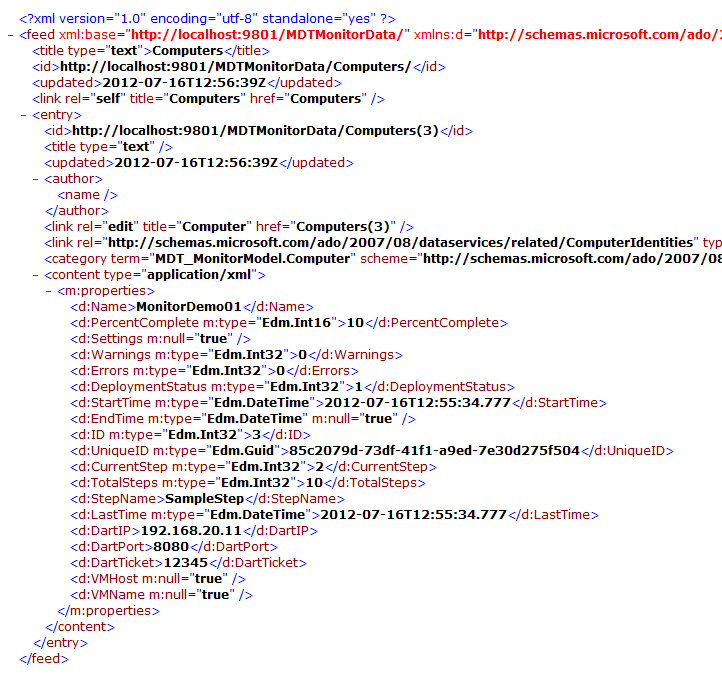
As it is a web service, you can read the information using your favorite browser and point it to http://localhost:9801/MDTMonitorData/ (replace localhost with the name to your MDT server) and you will get an ODATA feed as response, where you could then dig deeper into the different entities like
http://localhost:9801/MDTMonitorData/Computers/
or
http://localhost:9801/MDTMonitorData/ComputerIdentities/
The response you see seems a bit freaky, but it’s pretty easy to read and handle, when you need to write some custom code.
If you look closely, you will see, that the above screenshot shows, that some information is missing, that is being posted to the web service, namely the message id, severity and the message itself. Instead it contains some calculated values like “PercentComplete” or Start and Endtime.
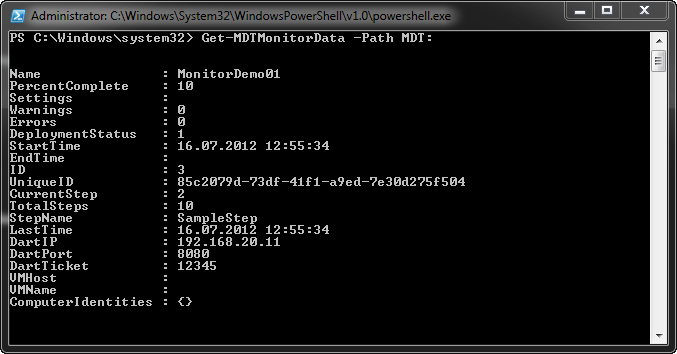
However, as MDT is completely based on PowerShell, you can also use it to show this information. To do so, we just add the MDT cmdlet
|
1 |
Add-PSSnapin 'Microsoft.BDD.PSSNAPIN' |
Then we attach the Deployment Share as new drive
|
1 |
New-PSDrive -Name MDT -Root 'C:DeploymentShare' -PSProvider MDTPROVIDER |
Now we can use the Get-MDTMonitorData function to read the information
|
1 |
Get-MDTMonitorData -Path MDT: |
Basically the same information we have seen before. There is also a function called Set-MDTMonitorData, which one could think, that it can be used to add information to the web service, but this is just for testing purposes.
Processing the events
So, what can we do, if we want to make use of this information for other purposes? Or better to say, what about using all the information that is being posted and not just the ones, that MDT is storing for us?
It’s using a web service. So how about writing our own solution, that consumes this events? I’ll guide you through the details on how to do that in the next post.


Recent Comments