Debugging VBScript and JScript in vbs, js, wsf and hta files
Many of us have to deal with some kind of scripts. I know the future is Powershell but there are still so many existing scripts flying around and also there are some situations where you simply need to use something “old” like VBScript. Anyway. I’m not going to talk about the why and why not. This is simply about the fact that I had to deal with VBScript quite a lot, especially in the last time due to some Deployments (Hey Microsoft! When will Windows PE support .Net?).
As writing on those scripts you often have to deal with some problems, errors, etc. Finding those errors can become a cumbersome task sometimes. Especially if they become larger and larger or even worse reference other scripts during runtime. So I personally always try to add a lot of logging information in everything I write. So if anything happens you can at least localize the area of the possible cause. Sometimes I asked myself why it wasn’t so easy to debug this damn vbscripts like it is in VB.Net. Having a debugger to step into the code. Go through the code line by line and check the current status of variables.
I know. Most of you will now say “Why didn’t you just do it that way?“. To be honest, I wasn’t aware that this is possible. Call it ignorance, laziness or simply foolishness 😉 Shame on me. And for the vague chance that there is any other poor guy (or girl, even if the percentage of females within IT is quite small) also dealing with this. This post is dedicated to you and to save you a bit time!!! 🙂
Actually all I wanted to have available for my script debugging as mentioned before is already there. So just follow me through the rest of this post and make your life easier. This will work in most Development Environments.But this documentation and examples are based on Visual Studio 2008. If you don’t have access to a full version of Visual Studio, just grab any version of Visual Studio Express 2005 (Web Developer should be enough). There isn’t any official download from Microsoft, currently they only offer the Visual Studio Express 2008 version. But for some reason they dropped the debugging support in it. But there are still a couple places where to get them, just be creative ;-).
OK, we just wrote a bunch of scripts and nothing works as it should. Strange errors with “Object required” are popping up running us mad. We need to debug them so let’s start with the most direct approach. We simply start our script with a debugging option (How easy was that?). If you run a script you normally just double-click it. If you do this, the script will be executed by either wscript.exe or cscript.exe within the Windows Scripting Host. Typically this is wscript.exe. The difference between them is more or less only that output from your script will be written to a window that pops up (wscript.exe) and wait’s until it gets closed before it continues or to the command line (cscript.exe).
But we don’t want to run it this way. We just said, we want to execute the script with a debugging option. So you simply call
|
1 |
cscript.exe ScriptPathAndName.vbs //X |
(wscript.exe will work accordingly)
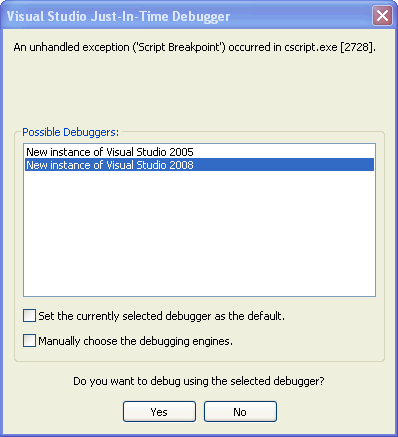
and you will see a pop up like this.
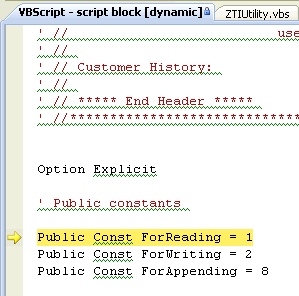
Here you can choose now any of the available/installed debuggers from your computers. It will then open the choosen Debugger, which will be Visual Studio in my case, and show you the script:
The yellow marked line is the current position in the script. Before going further, have a look on the header. In my case it says “VBScript – script block [dynamic]”. The [dynamic] is, what makes it really nice. In this example I called a wsf file which references a couple other vbs files. So the Debugger takes all these files and combines them in one single dynamic script. Isn’t that great?
Now we can step through the code by either using the debugging toolbar ![]() or simply using the following key commands:
or simply using the following key commands:
- F11 (Step into) – This is used to step through each line of the script. It will also “step into” functions or anything else which will get called.
- Shift+F11 (Step out) – This is used if you are within a function and want to break out to the next line of code outside of this function.
- F10 (Step over) – This will also step through each line of code but will not step into a called function.
- F5 (Continue) – This will just continue the script and just step back into the debugger if a breakpoint is set, an unhandled exception occurs or a Stop command is set (will get back to this later).
After reading those key command I guess the debugging toolbar is quite self explaining.
I mentioned already the “Breakpoint“. By setting Breakpoints you will be able to define parts in your code you would like to debug. So instead of going through the whole code by each single line (which can be time consuming sometimes) you simply tell the debugger to which point it shall go through the code before stepping back into it. This is also helpful to be set within certain conditions. Let’s assume you have an If condition in your code where you check for the content of some variable. Normally you are not interested to see this part of code but if this condition occurs you would like to step into it and get more information. Then you just add a breakpoint. To do this you simply left-click on the grey bar on the left side just in the line of code you would like to see and some kind of red bubble will show up. Another click and the Breakpoint is removed again.
A similar behavior can be achieved if you simply add the keyword Stop in your VBScript code (or debugger in your JScript Code).
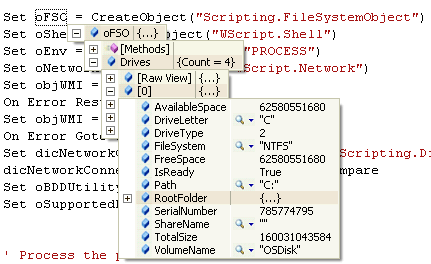
The next great help for our debugging is, that we are able to see the current values of all variables. If you are debugging some code just move your mouse over the variable your are interested in and keep it there for a moment. It will show a small window beneath with the content of this variable. This works for simple types like Strings
and even for complex objects
You can also press CTRL+ALT+Q to get the “Quickwatch” Window for the variable your Cursor is currently located at. Additionally you can right click any variable and choose “Add Watch” which will add this variable to a “Watch” Window, generally at the bottom area of your debugger window. This makes it possible to watch the value (and more important the changes) to a couple of variables as you are stepping through your code.
Just next to the “Watch” Window you should be able to see a Window called “Locals”. If you don’t see this, add it via Debug – Windows – Locals Menu (Or Press Ctrl+Alt+V and L). This is a quite neat window as it will show you all variables within the current context so that you don’t need to add or remove them by yourself to the watch window.
There is a second option to execute a script. As said, the //X started the debugger immediately with the first line of code. But sometimes you don’t want to see the whole code. You just would like to be able to step into it if an error or a certain condition occurs within your script. I already mentioned the Stop keyword which will call the debugger if debugging is enabled. To achieve this behavior you simply execute the script with the //D option:
|
1 |
cscript.exe ScriptPathAndName.vbs //D |
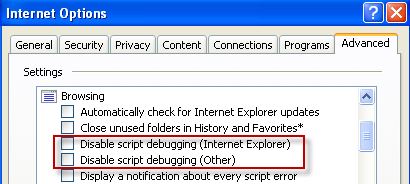
And finally, there is a third option to enable debugging. This option applies if you can’t execute a script with an parameter (as it maybe get’s called by some other process) and especially if debugging hta files (As they run within the mshta.exe process and not via cscript.exe or wscript.exe). Yes, we can even debug our hta frontends. And here comes the tricky part. This option needs to be set via your Internet Explorer! Go to your Internet Options (in the Tools menu) and have a look on the Advanced Tab. There are two options you would need to uncheck!
They say “Disable script debugging” so you need to uncheck them to enable script debugging.
But be aware. As soon as you enable script debugging each single error on any Internet page (if you enabled script debugging for Internet explorer) will pop up this window and ask you to debug it. So you probably only want to enable this option if you are debugging something and then set it back to it’s original value.
So all you need to do now to debug your hta is simply enabling this option and then just set a Stop somewhere in the code where you would like to step into it (or wait for an error 🙂 ).
And finally, what I’m really interested in is, how many of you had the same problem not knowing how easy this actually is? So if the same happened to you, just let us have a beer and laugh about all these wasted hours 🙂
Update: I removed the download link to Visual Studio Express 2008. I incorrectly assumed, that it would be able to debug vbscript. Visual Studio 2005 (express and all full version did) and 2008 full version was working fine. I actually never tested 2008 Express as I was writing this article. But became aware by some readers that Microsoft dropped the script debugging in the 2008 Express Edition. I have no real clue why and wasn’t able to find a good answer for this. I appologize for the mis-information. But just use 2005 Express, it is still working and you probably have it somewhere on one of your CDs/DVDs.
Update 2: Microsoft just released the Visual Studio community edition. Finally a free edition, that supports all debugging features as described in this post.


1 Response
[…] of the most popular posts I’ve written so far was about using Visual Studio Express to debug VBScript and JavaScript in local scripts, hta files etc. Probably not popular in terms of the absolute count of visitors, as the target audience of my blog […]